![[Stable]](figures/lifecycle-stable.svg)
The function fits a CFA model using the lavaan::cfa(). Users can fit single and multiple factors CFA, and it also supports multilevel CFA (by specifying the group).
Users can fit the model by passing the items using dplyr::select() syntax or an explicit lavaan model for more versatile usage.
All arguments (except the CFA items) must be explicitly named (e.g., model = your-model; see example for inappropriate behavior).
cfa_summary(
  data,
  ...,
  model = NULL,
  group = NULL,
  ordered = FALSE,
  digits = 3,
  estimator = "ML",
  model_covariance = TRUE,
  model_variance = TRUE,
  plot = TRUE,
  group_partial = NULL,
  streamline = FALSE,
  quite = FALSE,
  return_result = FALSE
)
Arguments
- data
data frame
- ...
CFA items. Multi-factor CFA items should be separated by comma (as different argument). See below for examples. Support
dplyr::select()syntax.- model
explicit
lavaanmodel. Must be specify withmodel = lavaan_model_syntax.![[Experimental]](figures/lifecycle-experimental.svg)
- group
optional character. used for multi-level CFA. the nested variable for multilevel dataset (e.g., Country). Support
dplyr::select()syntax.- ordered
Default is
FALSE. If it is set toTRUE,lavaanwill treat it as a ordinal variable and useDWLSinstead ofML- digits
number of digits to round to
- estimator
estimator for lavaan. Default is
ML- model_covariance
print model covariance. Default is
TRUE- model_variance
print model variance. Default is
TRUE- plot
print a path diagram. Default is
TRUE- group_partial
Items for partial equivalence. The form should be c('DV =~ item1', 'DV =~ item2').
- streamline
print streamlined output
- quite
suppress printing output
- return_result
If it is set to
TRUE, it will return thelavaanmodel
Value
a lavaan object if return_result is TRUE
Details
First, just like researchers have argued against p value of 0.05 is not a good cut-of, researchers have also argue against that fit indicies (more importantly, the cut-off criteria) are not completely representative of the goodness of fit. Nonetheless, you are required to report them if you are publishing an article anyway. I will summarize the general recommended cut-off criteria for CFA model below. Researchers consider models with CFI (Bentler, 1990) that is > 0.95 to be excellent fit (Hu & Bentler, 1999), and > 0.9 to be acceptable fit. Researchers considered a model is excellent fit if CFI > 0.95 (Hu & Bentler, 1999), RMSEA < 0.06 (Hu & Bentler, 1999), TLI > 0.95, SRMR < 0.08. The model is considered an acceptable fit if CFI > 0.9 and RMSEA < 0.08. I need some time to find all the relevant references, but this should be the general consensus.
References
Hu, L., & Bentler, P. M. (1999). Cutoff criteria for fit indexes in covariance structure analysis: Conventional criteria versus new alternatives. Structural Equation Modeling, 6, 1–55. https://doi.org/10.1080/10705519909540118
Examples
# REMEMBER, YOU MUST NAMED ALL ARGUMENT EXCEPT THE CFA ITEMS ARGUMENT
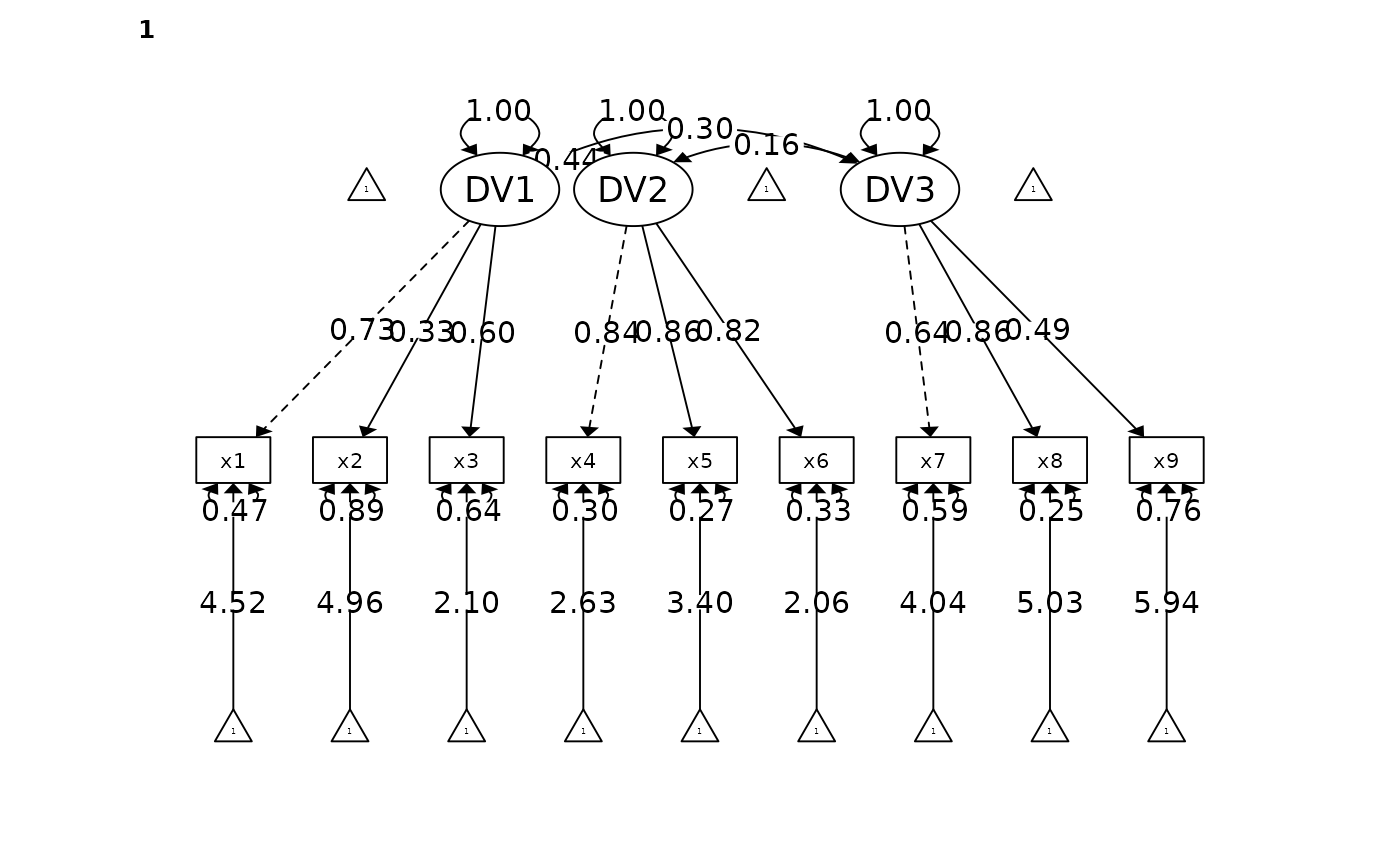
# Fitting a multilevel single factor CFA model
fit <- cfa_summary(
data = lavaan::HolzingerSwineford1939,
x1:x3,
x4:x6,
x7:x9,
group = "sex",
model_variance = FALSE, # do not print the model_variance
model_covariance = FALSE # do not print the model_covariance
)
#>
#>
#> Model Summary
#> Model Type = Confirmatory Factor Analysis
#> Estimator: ML
#> Group = sex
#> Model Formula =
#> . DV1 =~ x1 + x2 + x3
#> DV2 =~ x4 + x5 + x6
#> DV3 =~ x7 + x8 + x9
#>
#> Fit Measure
#> ──────────────────────────────────────────────────────────────────────────────────────
#> Χ² DF P CFI RMSEA SRMR TLI AIC BIC BIC2
#> ──────────────────────────────────────────────────────────────────────────────────────
#> 105.795 48.000 0.000 *** 0.935 0.089 0.063 0.903 7517.633 7740.060 7549.774
#> ──────────────────────────────────────────────────────────────────────────────────────
#> *** p < 0.001, ** p < 0.01, * p < 0.05, + p < 0.1
#> You can drag and resize the R console to view the entire table
#>
#>
#> Factor Loadings
#> ───────────────────────────────────────────────────────────────────────────────────────
#> Latent.Factor Observed.Var group Std.Est SE Z P 95% CI
#> ───────────────────────────────────────────────────────────────────────────────────────
#> DV1 x1 1 0.725 0.094 7.736 0.000 *** [0.541, 0.909]
#> x2 0.329 0.094 3.495 0.000 *** [0.144, 0.513]
#> x3 0.602 0.089 6.729 0.000 *** [0.426, 0.777]
#> DV2 x4 0.835 0.035 23.613 0.000 *** [0.766, 0.904]
#> x5 0.857 0.034 25.461 0.000 *** [0.791, 0.923]
#> x6 0.818 0.037 22.222 0.000 *** [0.746, 0.890]
#> DV3 x7 0.644 0.077 8.408 0.000 *** [0.494, 0.794]
#> x8 0.864 0.081 10.606 0.000 *** [0.704, 1.023]
#> x9 0.490 0.079 6.237 0.000 *** [0.336, 0.644]
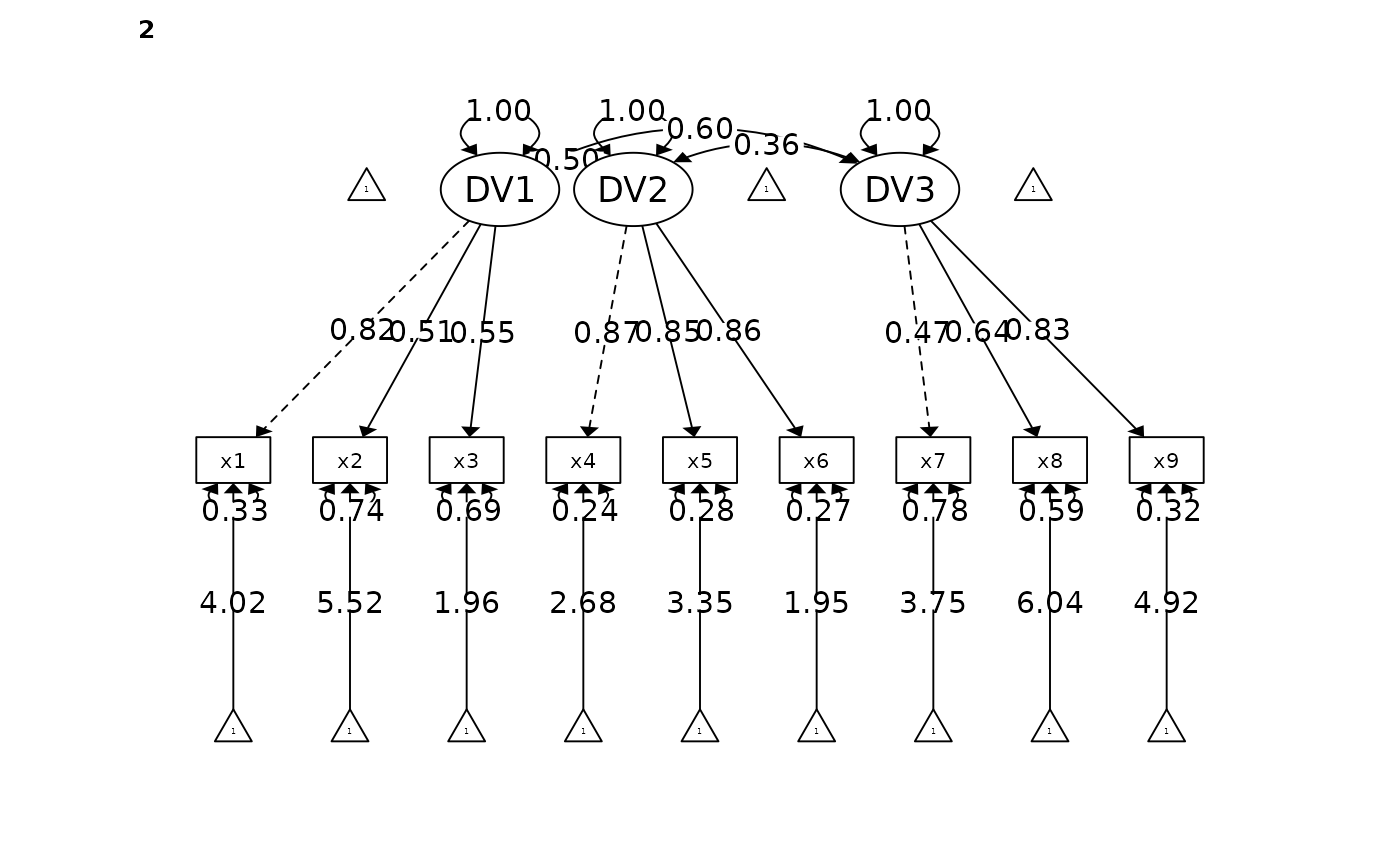
#> DV1 x1 2 0.820 0.062 13.212 0.000 *** [0.699, 0.942]
#> x2 0.511 0.073 6.962 0.000 *** [0.367, 0.654]
#> x3 0.553 0.071 7.813 0.000 *** [0.414, 0.692]
#> DV2 x4 0.872 0.028 30.994 0.000 *** [0.817, 0.927]
#> x5 0.850 0.030 28.253 0.000 *** [0.791, 0.909]
#> x6 0.856 0.030 28.930 0.000 *** [0.798, 0.914]
#> DV3 x7 0.469 0.076 6.184 0.000 *** [0.320, 0.618]
#> x8 0.638 0.067 9.485 0.000 *** [0.506, 0.770]
#> x9 0.827 0.064 12.945 0.000 *** [0.702, 0.952]
#> ───────────────────────────────────────────────────────────────────────────────────────
#> *** p < 0.001, ** p < 0.01, * p < 0.05, + p < 0.1
#> You can drag and resize the R console to view the entire table
#>
#>
#> Goodness of Fit:
#> Warning. Poor χ² fit (p < 0.05). It is common to get p < 0.05. Check other fit measure.
#> OK. Acceptable CFI fit (CFI > 0.90)
#> Warning. Poor RMSEA fit (RMSEA > 0.08)
#> OK. Good SRMR fit (SRMR < 0.08)
#> OK. Acceptable TLI fit (TLI > 0.90)
#> Warning. Some poor factor loadings (some loadings < 0.4)
 # Fitting a CFA model by passing explicit lavaan model (equivalent to the above model)
# Note in the below function how I added `model = ` in front of the lavaan model.
# Similarly, the same rule apply for all arguments (e.g., `ordered = FALSE` instead of just `FALSE`)
# \donttest{
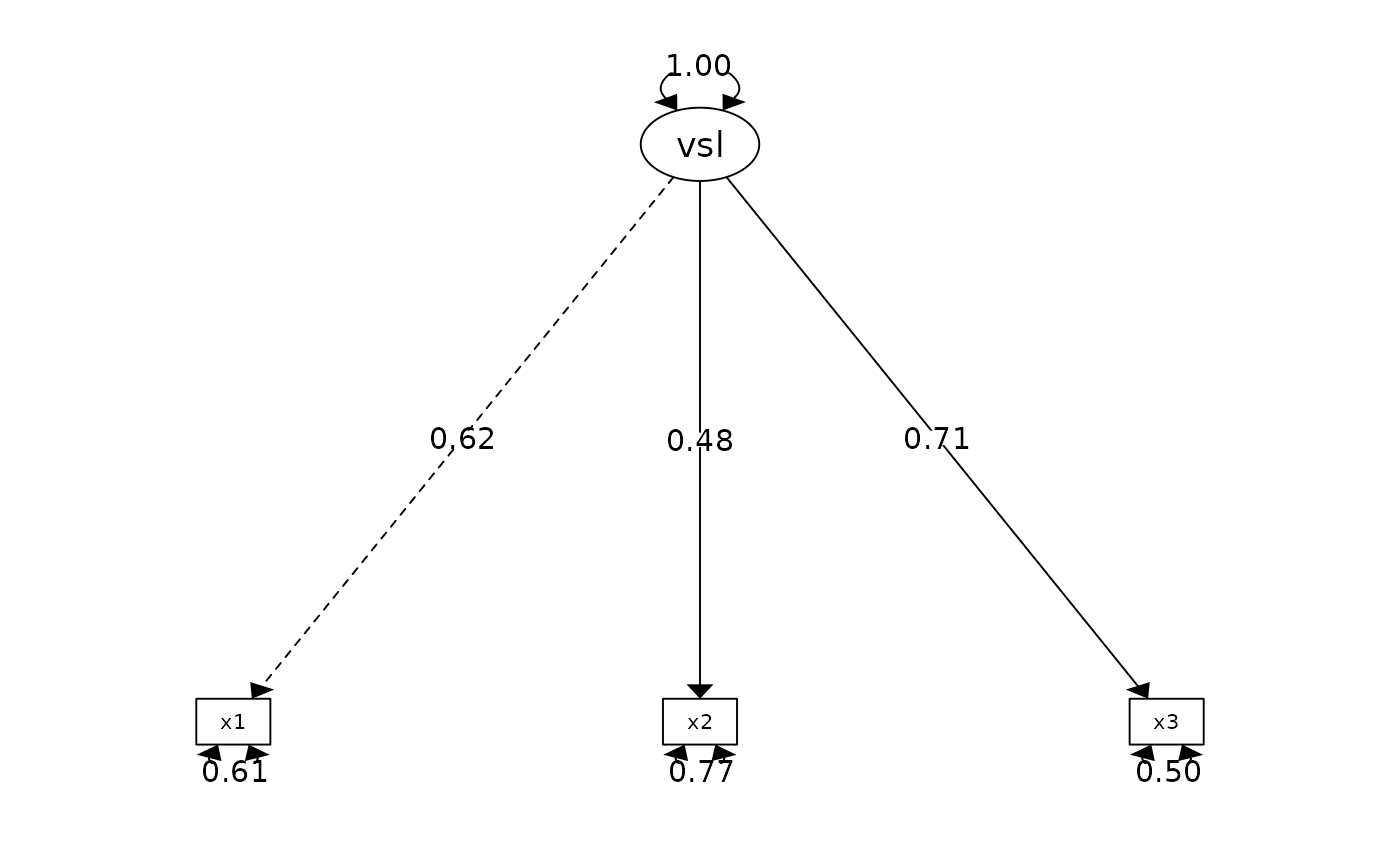
fit <- cfa_summary(
model = "visual =~ x1 + x2 + x3",
data = lavaan::HolzingerSwineford1939,
quite = TRUE # silence all output
)
# Fitting a CFA model by passing explicit lavaan model (equivalent to the above model)
# Note in the below function how I added `model = ` in front of the lavaan model.
# Similarly, the same rule apply for all arguments (e.g., `ordered = FALSE` instead of just `FALSE`)
# \donttest{
fit <- cfa_summary(
model = "visual =~ x1 + x2 + x3",
data = lavaan::HolzingerSwineford1939,
quite = TRUE # silence all output
)
 # }
if (FALSE) { # \dontrun{
# This will fail because I did not add `model = ` in front of the lavaan model.
# Therefore,you must add the tag in front of all arguments
# For example, `return_result = 'model'` instaed of `model`
cfa_summary("visual =~ x1 + x2 + x3
textual =~ x4 + x5 + x6
speed =~ x7 + x8 + x9 ",
data = lavaan::HolzingerSwineford1939
)
} # }
# }
if (FALSE) { # \dontrun{
# This will fail because I did not add `model = ` in front of the lavaan model.
# Therefore,you must add the tag in front of all arguments
# For example, `return_result = 'model'` instaed of `model`
cfa_summary("visual =~ x1 + x2 + x3
textual =~ x4 + x5 + x6
speed =~ x7 + x8 + x9 ",
data = lavaan::HolzingerSwineford1939
)
} # }